Back to All Projects

SEQ Public Transport (GTFS) Analysis

Route dominance, hub centrality, weekday bias & commuter peak patterns extracted from Translink GTFS schedule feeds.

Python PostgreSQL GTFS Folium EDA

Technology Stack

Python 3 Pandas NumPy PostgreSQL SQL Matplotlib Seaborn Folium Power BI Jupyter Git/GitHub

Methodology

  1. ETL: Ingest GTFS text feeds → PostgreSQL; enforce types, de‑duplicate, normalize naming.
  2. Analysis: SQL window functions (RANK, ROW_NUMBER) + Python for aggregation & temporal / spatial visuals.

Interactive Power BI Dashboard

Login to Power BI may be required for full interactivity.

Interactive KPI & hub exploration (Power BI)

Request Power BI Source File (.pbix)

Enter your email to receive the complete Power BI dashboard file with all data models and visualizations.

The file includes all data connections, DAX measures, and custom visualizations used in this analysis.

Findings and Visualizations

Strategic analysis of SEQ public transport patterns revealing network structure, operational rhythms, and infrastructure priorities.

1. The Network Backbone: Dominance of High-Frequency Bus Routes

Analysis of route frequency reveals the hierarchical structure of Brisbane's bus network and service concentration patterns.

Top 10 bus routes by scheduled trips
Figure 1: Frequency concentration (CityGlider & UQ Lakes corridors)

Network Backbone Analysis

Finding

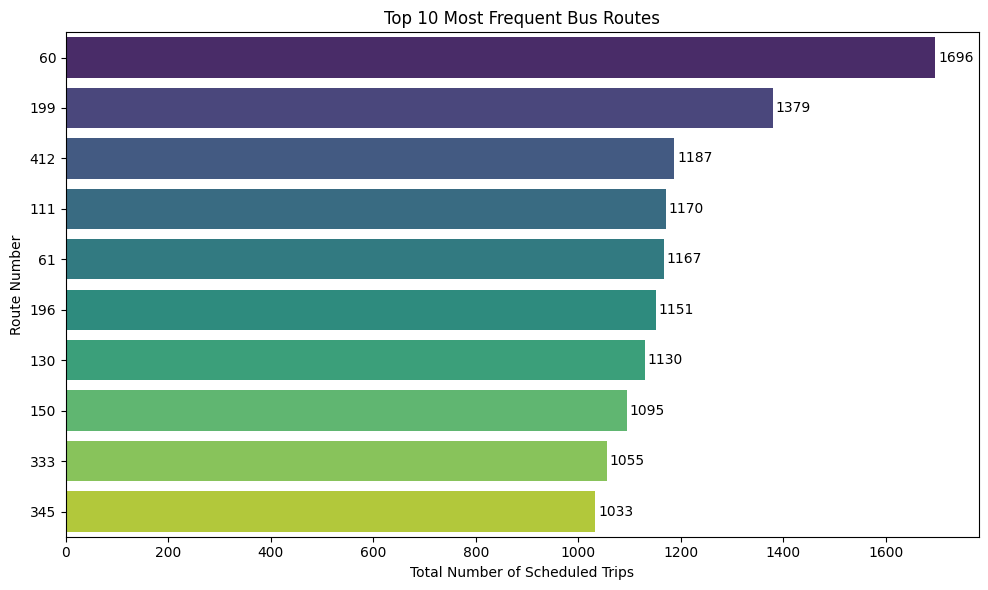
The bus network is not uniform; it operates on a "hub and spoke" model where a few key routes act as high-frequency arteries. Route 60 (CityGlider) is the most frequent in the entire network, with 1,696 scheduled trips. It is followed by Route 199 (1,379 trips) and Route 412 (1,187 trips). The data shows a steep drop-off in frequency after the top 10 routes, confirming that a small subset of routes handles a disproportionately large share of service.

Route 60 (CityGlider)
1,696
scheduled trips
Route 199
1,379
second highest
Network Model
Hub & Spoke
arterial structure

Strategic Takeaway for Translink

These top-tier routes are the lifeblood of the network. Their reliability and frequency are critical to public perception and overall system performance.

Infrastructure Priority

Prioritize for dedicated bus lanes and signal priority upgrades

Expansion Blueprint

Use success model for future high-frequency corridors in underserved areas

2. The Operational Cadence: A Network Built for the Work Week

Service level analysis revealing the stark weekday-weekend operational divide and market opportunity gaps.

Trips per weekday vs weekend
Figure 2: Weekend volume collapse

Operational Cadence Analysis

Finding

The network is heavily optimized for weekday travel. From Monday to Thursday, service levels are remarkably consistent, averaging around 52,640 scheduled trips per day. Service begins to taper on Friday (49,243 trips) before a precipitous drop of over 60% on the weekend, falling to just 19,692 trips on Saturday and 18,629 on Sunday.

Weekday Average
52,640
trips per day
Weekend Drop
60%+
service reduction
Sunday Service
18,629
lowest volume

Strategic Takeaway for Translink

This operational model presents a strategic choice. For serving the 9-to-5 commuter economy, the network is efficiently structured. However, this weekday bias presents a significant opportunity gap.

Weekend Economy Opportunity

Conduct demand analysis for weekend travel on key entertainment corridors, pilot increased frequency on routes like CityGlider to capture untapped market

3. The Geographic Center: Primacy of the Brisbane CBD

Hub centrality analysis revealing the critical importance of CBD infrastructure and potential vulnerabilities.

Busiest stops (bus & train)
Figure 3: Hub clustering in CBD

Geographic Center Analysis

Finding

The network's activity is overwhelmingly concentrated in the Brisbane CBD. Cultural Centre station, platform 1 is the single busiest bus stop, registering over 14,000 arrivals/departures. For trains, Fortitude Valley station, platform 2 and Bowen Hills station, platform 2 are the busiest, with approximately 3,700 activities each. The top 10 lists for both bus and train hubs are exclusively located within or directly adjacent to the CBD.

Cultural Centre
14,000+
busiest bus stop
Fortitude Valley
3,700
busiest train hub
Top 10 Hubs
100%
CBD/adjacent

Strategic Takeaway for Translink

The CBD is the heart of the SEQ network, but this centrality also makes it a potential single point of failure.

Resilience Priority

Infrastructure investments and service contingency planning must prioritize core hub resilience

Secondary Hub Strategy

Develop major secondary hubs (Chermside, Upper Mount Gravatt) for suburban-to-suburban travel

4. The Daily Rhythm: The Bimodal Commuter Peaks

Temporal analysis revealing the classic commuter pattern and operational efficiency opportunities.

Weekly activity heatmap
Figure 4a: Weekday plateau
Hourly activity heatmap
Figure 4b: AM/PM commuter peaks

Daily Rhythm Analysis

Finding

The hourly activity heatmap provides a vivid illustration of the classic commuter travel pattern. At the busiest stops, such as the Cultural Centre, activity skyrockets during the morning peak (7-9 AM), with hourly trip counts exceeding 1,000. Activity then subsides significantly during the middle of the day before surging again during the evening peak (4-6 PM). The period from midnight to 5 AM is virtually dormant across the entire network.

Morning Peak
7-9 AM
1,000+ trips/hour
Evening Peak
4-6 PM
bimodal pattern
Night Service
Dormant
midnight-5 AM

Strategic Takeaway for Translink

This bimodal peak requires maintaining a fleet and workforce sized for peak demand, leading to underutilization during off-peak hours.

Demand Shifting

Partner with employers for staggered work hours and launch off-peak travel marketing

Dynamic Pricing

Introduce time-of-day fare incentives to "flatten the curve"

5. Differentiating Network Roles: Frequency vs. Coverage

SQL window function analysis distinguishing route evaluation metrics and strategic purposes.

Network Roles Analysis

Finding

SQL window function analysis reveals a crucial distinction between route types. While routes like the CityGlider (60) have the highest frequency, they do not have the widest reach. The Great Circle Line routes (599 and 598) service the highest number of unique stops (173 and 172, respectively), functioning as vital connectors across a wide swath of suburbs.

Top Bus Routes by Unique Stops (excerpt)
route  stop_count  rank
599    173         1
598    172         2
330    109         3
...
Great Circle Lines
173
unique stops (599)
Coverage Strategy
CityGlider (60)
1,696
scheduled trips
Frequency Strategy

Strategic Takeaway for Translink

It is imperative to use the right metric to evaluate a route's purpose. Judging a high-coverage "connector" route like the Great Circle Line by the same frequency standards as a high-intensity "corridor" route would be a mistake.

Strategic Recognition

Extensive routes must be recognized and funded based on their strategic role in providing geographic access, not just raw trip volume

Limitations

Conclusion & Recommendations

Hypotheses validated: commuter orientation, CBD hub centrality, route dominance & pronounced bimodal temporal demand. Strategic next steps elevate reliability, access equity & off‑peak utilization.

Explore the Code

ETL scripts, SQL window queries & visualization notebooks are published for review.

View on GitHub
Back to Projects